Data visualization
MagicBox is a full-stack application. While the back-end API (magicbox-open-api) serves the data and makes it available for querying, the magicbox-maps application visualizes the data inside a world map.
How we do it
magicbox-maps draws the plot points using OpenStreetMap Leaflet and WebGL. WebGL allows us to render up to 16 million clickable points at once.
To do this inside of a React application like magicbox-maps, we created react-webgl-leaflet.
This React module enables us to render several plot points simultaneously, like we use for the school mapping data.
Every school is represented with a unique, clickable point.
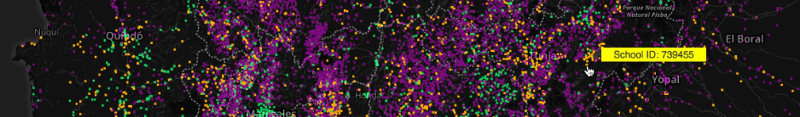
react-webgl-leaflet npm module
This is currently used for magicbox-maps.
Why we do it
Originally, we began using Leaflet markers. This worked well for Mauritania with 2,936 schools. However, when we moved to Colombia with 49,020 schools, performance took a significant hit. We experimented with a few other options, like heatmaps and clustering.
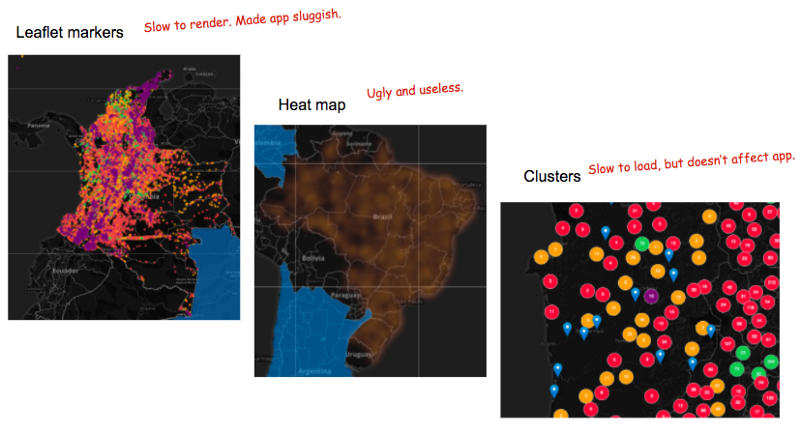
In the end, we decided on using WebGL, as explained above.